
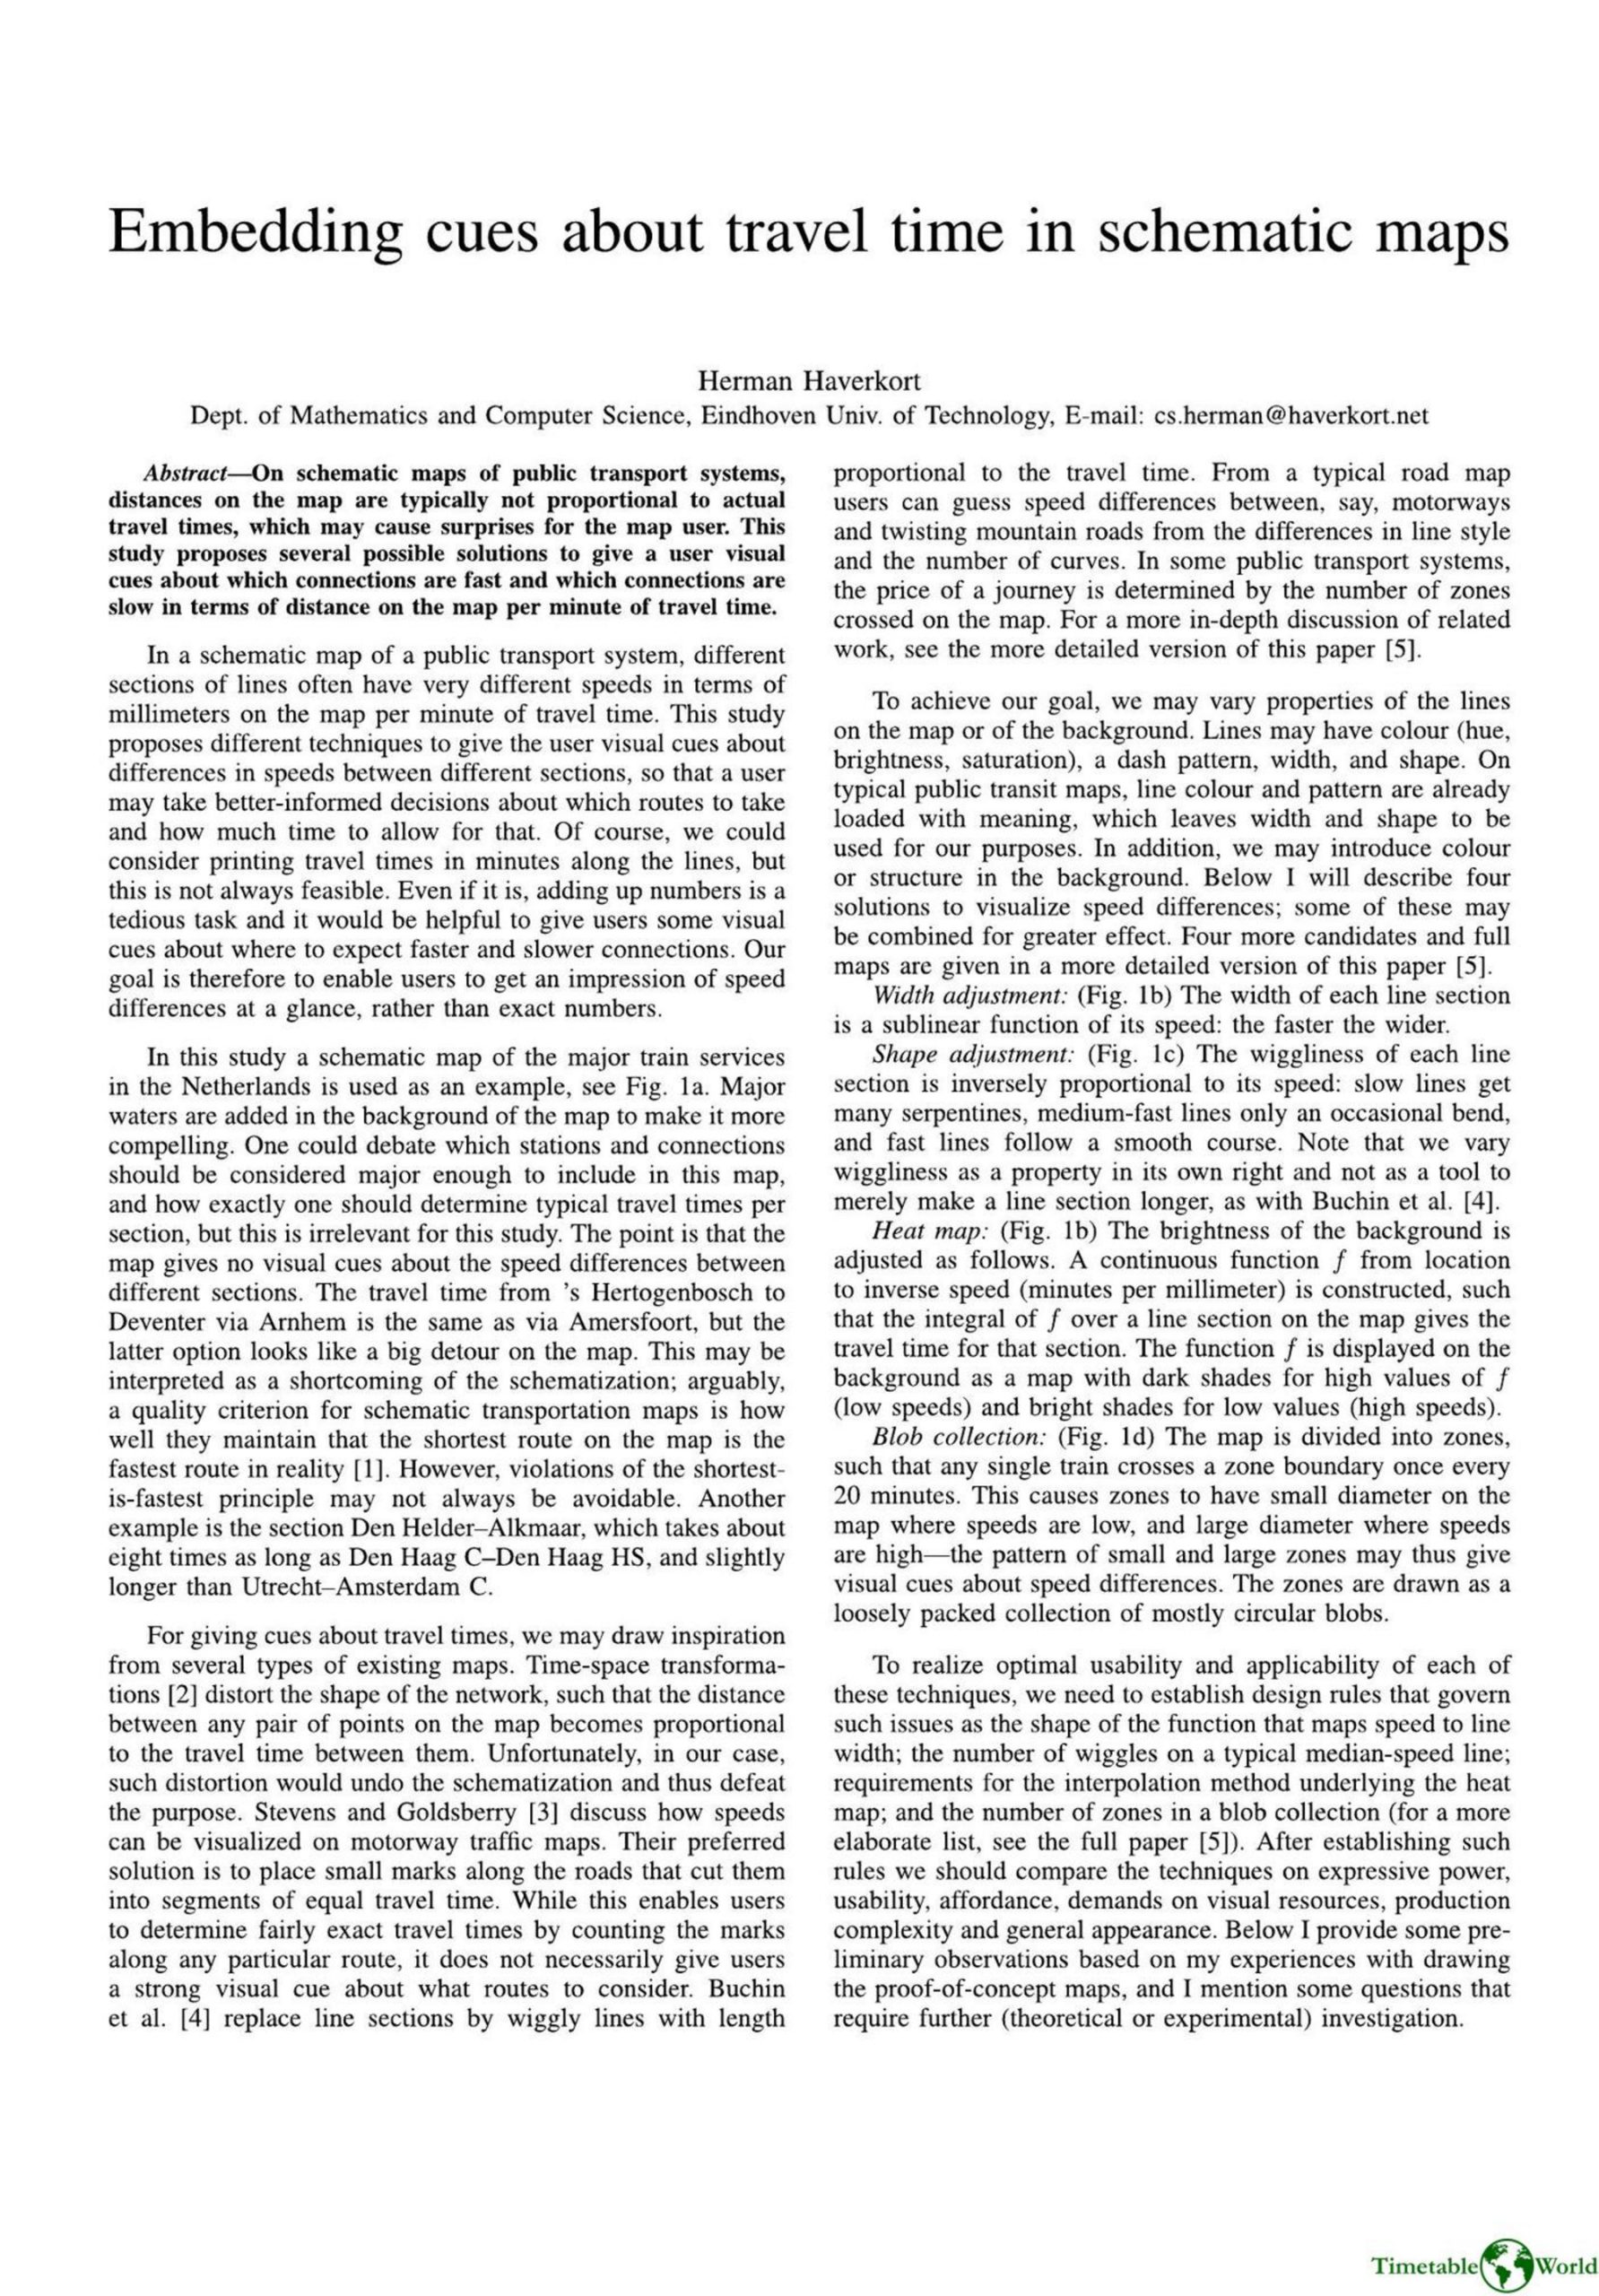
Haverkort – EMBEDDING CUES ABOUT TRAVEL TIME IN SCHEMATIC MAPS 2014
£0.00
A downloadable PDF file for your personal use. Timetable World has applied OCR to make the text searchable, and each page carries a small Timetable World logo.
Description
Herman Haverkort addresses how schematic public-transport maps often mislead users because map distances do not match travel times. He proposes visual cues to indicate section speeds (map millimeters per travel minute) so users can judge faster or slower connections at a glance rather than relying on numeric times. Using a Dutch rail map as example, he presents four techniques: width adjustment (faster sections drawn wider), shape adjustment (wiggliness inversely proportional to speed), a heat-map background encoding inverse speed continuously, and a blob-collection zoning (zones sized so trains cross a boundary every 20 minutes). He compares methods on expressive power, usability, affordance, visual clutter, production complexity and aesthetics: width and heat maps offer precise mappings; shape highlights slow sections but has limited discrimination; blobs suit long trips but can clutter and may lack feasible zone partitions. Haverkort calls for design rules, empirical evaluation, and algorithmic work (interpolation, zone generation) to optimize and compare these techniques.
Additional information
| Pages | 2 |
|---|---|
| Filesize | 1.1Mb |
Related products
-
Allsop – DETERMINING WHICH REQUIREMENTS OF PUBLIC TRANSPORT USERS IN LARGE CITIES COULD BE MET BY MODERN INFORMATION TECHNOLOGY 1987
£0.00 Add to basket -

Association of Train Operating Companies – PROVISION OF CUSTOMER INFORMATION 2016
£0.00 Add to basket -

Association of Transport Co-ordinating Officers – PUBLIC TRANSPORT INFORMATION GOOD PRACTICE 2005
£0.00 Add to basket -
Association of Train Operating Companies – PRESENTATION OF TIMETABLE INFORMATION 1997
£0.00 Add to basket